vLLM Inference Profiling
导言
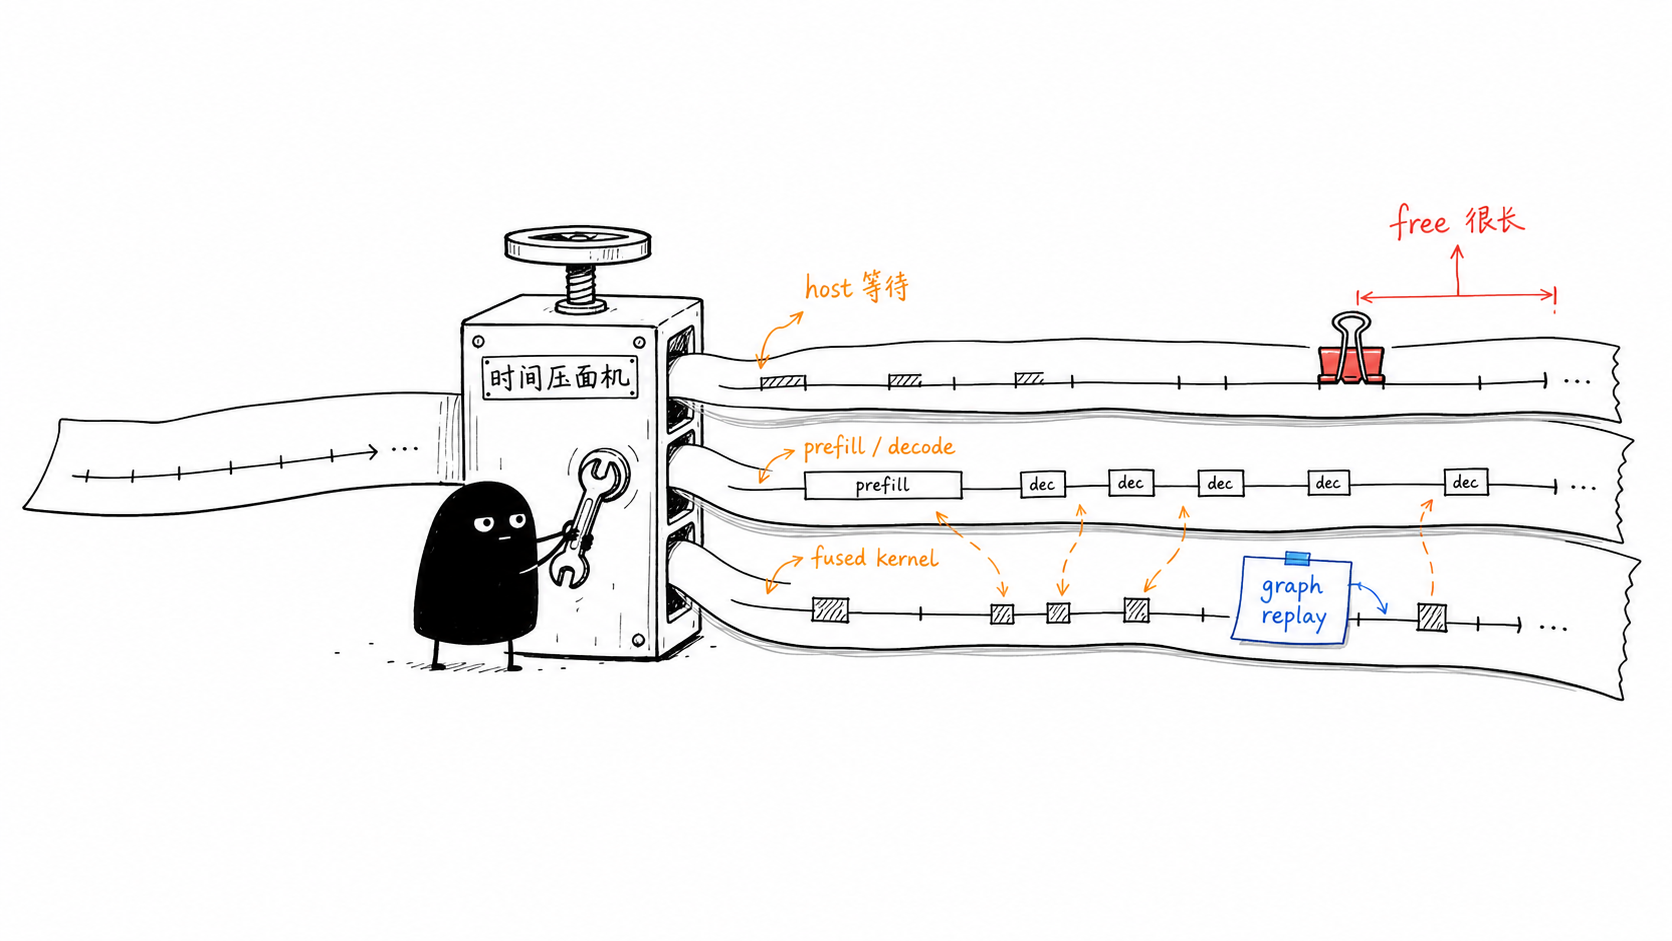
训练 profiling 通常围绕 forward、backward、optimizer 和通信几类稳定阶段展开;推理 profiling 则更像一条被压扁的多层时间带:prefill、decode、spec decode、采样、图模式、host 同步、调度空隙和特殊融合算子会叠在同一个 step 里。
这篇文章用一次 vLLM-Ascend trace 作为样本,先把 Free、vllm::gdn_attention_core、FusedInferAttentionScore、GemmaRmsNorm、fused_sigmoid_gating_delta_rule_update_kernel_0、aclnnInplaceUniform_DSARandomUniform_DSARandomUniform 这些名字拆开,再总结一套以后跟踪新模型融合算子的 checklist。
先看这次 trace
本次数据来自:
/Users/Zhuanz/Downloads/profiling/rollout/agent_loop_rollout_replica_0/rank0_856658_20260707191230571_ascend_pt/ASCEND_PROFILER_OUTPUT
先给结论:不要先从单个陌生 kernel 名字开始猜,而要先看 step 窗口、host API、device kernel 三层时间是否对齐。
| 观察对象 | 事实 | 解释边界 |
|---|---|---|
Step Stage |
528.78 s |
profiler 覆盖的是一个很宽的 rollout/session 窗口。 |
Step Computing |
68.26 s |
主体计算并没有覆盖完整 step。 |
Step Free |
460.52 s |
当前证据更像 step 窗口空隙,不应直接归因到某个 kernel 的释放开销。 |
| 主 device kernel 活跃区间 | 约前 83 s |
大多数热点 kernel 的 first/last timestamp 集中在 0.33 s 到 82.70 s。 |
| Top CANN host API | aclrtSynchronizeEvent 50.23 s,aclrtSynchronizeStreamWithTimeout 35.15 s |
host 等待和流同步需要单独看,不能混到 device kernel 里。 |
这说明本次 trace 的第一层问题不是“哪个算子跑了五百秒”,而是:模型实际忙的窗口和 profiler step 窗口严重不一致。如果要优化推理内核,应先截取更窄的请求窗口;如果要优化 rollout 端到端吞吐,则要继续看调度、等待、采样、数据搬运和环境循环。
为什么推理更难 profile
vLLM 的推理执行不是训练式的固定 step。PagedAttention 让 KV cache 以 block 方式管理请求状态,continuous batching 让不同请求在每个调度迭代里重新组合。1 对性能来说,这很好;对 profiling 来说,它会让一个 trace 同时出现几类不同语义的时间。
-
prefill 和 decode 的计算形态不同 prefill 通常处理较长 prompt,更偏计算密集;decode 每轮只生成少量 token,更容易受 batch shape、launch、HBM 访问、同步和采样影响。vLLM optimization 文档也把 chunked prefill 描述成一种兼顾 TTFT 和 ITL 的调度策略:decode 优先,prefill 按 token budget 切块。2
-
decode 也有预处理 对普通 attention,decode 需要准备 block table、seq len、mask、KV cache 索引等参数;对 GDN 这类 recurrent attention,还会有 conv1d state、SSM state、spec decode metadata、accepted token 等额外状态。
-
图模式会改写 profiler 名字 vLLM-Ascend 的 ACL graph wrapper 会按 batch descriptor 缓存图;没有图时直接调用 runnable,有图时 capture 或 replay。full graph replay 前还可能有 stream synchronize。5 所以同一个逻辑算子可能出现 dynamic 名字,也可能出现带 hash 的 static 名字。
-
采样不是模型层,但会在 trace 里很醒目 生成式推理在 logits 后还有 sampling、random、copy、output 处理。
aclnnInplaceUniform_DSARandomUniform_DSARandomUniform这类名字如果不分层,很容易被误认为模型 forward 的融合算子。 -
host 时间和 device 时间不是一回事
npu_fx_compiler inference、vllm::gdn_attention_core、aclrtSynchronizeEvent是 host/API 维度的线索;FusedInferAttentionScore_...、fused_sigmoid...kernel_0才是 device kernel 维度的线索。两层要先拆开,再关联。
融合算子字典
下面这张表是本次 trace 里最值得先记住的“算子字典”。其中带 hash 的 static 名字,我只把它当成图/shape 专门化之后的 profiler 标签;除非继续拿到更底层编译器命名规则,否则不应该把 hash 本身解释成语义。
| Profiler 名字 | 更合理的 base op | 源码入口 | 融合了什么 | 本次 trace 证据 |
|---|---|---|---|---|
GemmaRmsNorm_3f68f4a3c27727c75887c7423ff14492_high_performance_0 |
Gemma RMSNorm | vllm_ascend/ops/layernorm.py::AscendGemmaRMSNorm.forward_oot,vllm_ascend/device/device_op.py::npu_gemma_rms_norm |
Gemma RMSNorm 的 NPU custom op;无 residual 时走 DeviceOperator.npu_gemma_rms_norm。 |
static 版本 4113 次,51.34 ms,平均 12.48 us;dynamic 版本只出现少量大 shape/warmup。 |
fused_sigmoid_gating_delta_rule_update_kernel_0 |
GDN decode recurrent update | vllm_ascend/ops/triton/fla/sigmoid_gating.py |
sigmoid/softplus gating、QK L2 norm、hidden state decay、delta rule update、beta gating、state writeback、output reduction。 | 74034 次,18.55 s,占 device 总时间约 23.98%,是本 trace 第一热点。 |
aclnnInplaceUniform_DSARandomUniform_DSARandomUniform |
sampling/random uniform path | profiler 中对应 aclnnInplaceUniform、aclrtRandomNumAsync,上层需用窄 trace 继续定位 |
随机数生成/原地 uniform,当前更像采样路径,不是 transformer attention 或 GDN 层数学。 | 4128 次,6.09 s,输出 shape 多为 N x 248320,和 vocab 维度/采样更接近。 |
FusedInferAttentionScore_3b093497fc536d61a77a7a3293a524da_5000000000010200203 |
Ascend FIA | vllm_ascend/attention/attention_v1.py,CANN FusedInferAttentionScore |
CANN 将 PromptFlashAttention 和 IncreFlashAttention 统一在一个推理 attention 接口里;Q_S=1 走增量分支,否则走 prompt 分支。8 |
static 版本 24678 次,8.12 s;dynamic FusedInferAttentionScore 只有 90 次,约 15.04 ms。 |
不要按名字直觉归因
aclnnInplaceUniform_DSARandomUniform_DSARandomUniform 很热,但它不代表模型层里多了一个神秘 attention;vllm::gdn_attention_core 看起来像一个单一 op,但内部会根据 metadata 分支。推理 profiling 的第一原则是:先分域,再分阶段,最后才解释收益。
GDN attention core 是 prefill 吗
短答案:不是 prefill-only。
在 vLLM 主仓里,qwen_gdn_attention_core 是一个自定义 op,注释说明它只处理 conv1d + recurrent attention,输入/输出 projection 由调用者完成。vLLM-Ascend 的 GDN wrapper 在完成 input projection、q/k/v/z 和 gate 参数准备后,调用:
真正决定 prefill 还是 decode 的,是 GDNAttentionMetadata。_forward_core 里面至少有三类路径:
- spec decode:用
fused_sigmoid_gating_delta_rule_update(...)处理 speculative tokens。 - non-spec decode:decode-only 或 mixed decode 部分也会用
fused_sigmoid_gating_delta_rule_update(...)。 - prefill chunk:prefill 部分用
chunk_gated_delta_rule(...),并写回 recurrent state。
vLLM 的 GDN metadata builder 会用 split_decodes_and_prefills(..., decode_threshold=1) 把 query length 小于等于 1 的请求归入 decode。6 所以 profiler 里出现 vllm::gdn_attention_core 时,正确问法不是“它是不是 prefill”,而是:
- 当前 event 对应的 metadata 里
num_prefills、num_decodes、num_spec_decodes各是多少? - 这一段是否 mixed decode+prefill,decode 是否被 peel 到前面单独处理?
- 对应 device kernel 是
chunk_gated_delta_rule还是fused_sigmoid_gating_delta_rule_update_kernel_0?
本次 trace 的 device 热点主要落在 fused_sigmoid_gating_delta_rule_update_kernel_0,因此热点更偏 GDN decode/spec-decode recurrent update;但这不等于所有 vllm::gdn_attention_core host event 都是 decode,也不等于没有 prefill 分支。
Fused sigmoid GDN kernel
Gated Delta Networks 论文把 gated memory control 和 delta rule update 组合起来,用于长上下文、高吞吐的线性注意力式模型结构。9 对 profiling 来说,这意味着 Qwen3.5 一类模型里会出现不是普通 attention、也不是 MLP 的 recurrent state kernel。
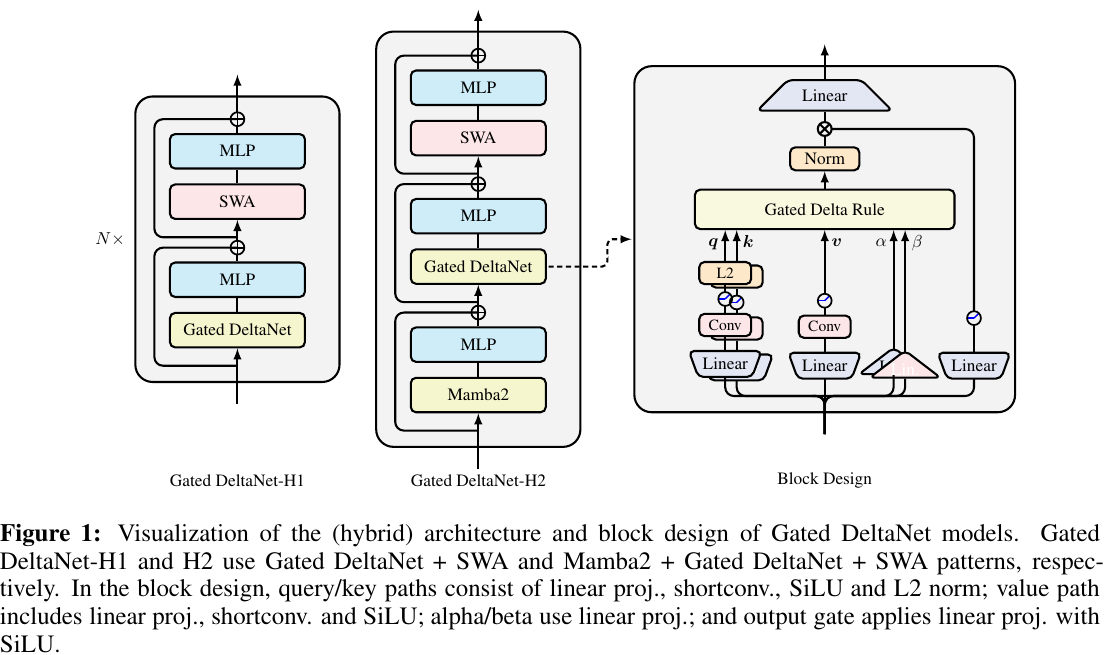
fused_sigmoid_gating_delta_rule_update_kernel_0 的源码注释直接说明它把 sigmoid gating 和 recurrent delta rule update 合成一个 Triton kernel。核心循环大致做这些事:
- 计算 gate:
g = -exp(A_log) * softplus(a + dt_bias),beta = sigmoid(b)。 - 可选归一化:在 kernel 内做
q/kL2 norm。 - 衰减状态:
h *= exp(g)。 - delta update:
v -= sum(h * k),再乘beta。 - 写回状态:
h += k * v,最后把 state 写回initial_state。 - 输出 token 表示:
o = sum(h * q)。
融合收益主要来自三点:
- 减少中间张量写回:gate、delta update、state update 和 output reduction 不需要拆成一串小 kernel。
- 把 recurrent state 留在更近的存储层级:至少在一个 token-loop 内减少来回读写。
- 降低 decode 小 token 场景的 launch/同步开销:decode 的 token 粒度小,融合比训练中的大矩阵更重要。
这也是为什么本次 trace 里它能超过 MatMulV2,成为第一热点。它不是“奇怪的编译器残留”,而是 GDN decode 路径的核心算子。
FusedInferAttentionScore
CANN 文档把 FusedInferAttentionScore 定义为适配增量和全量推理场景的 FlashAttention 算子:Q_S=1 时走 IncreFlashAttention,其余场景走 PromptFlashAttention。8 vLLM-Ascend 的 attention_v1.py 在普通 forward、full graph capture、graph param update 路径里都会调用 torch_npu.npu_fused_infer_attention_score 或对应的 .out(...) 形式。
这解释了为什么 trace 里有两种形态:
FusedInferAttentionScore:dynamic 形态,可能来自 warmup、未捕获 shape 或普通路径。FusedInferAttentionScore_3b..._500...:static 形态,更像图模式下针对固定 shape/参数组合生成的专门化 kernel 标签。
本次 static 版本出现 24678 次,总计 8.12 s;dynamic 版本只有 90 次,总计 15.04 ms。这说明 steady-state 路径很可能已经落在 static graph replay 上。优化它时,不应只搜 FusedInferAttentionScore_3b... 全名,而应先按 base op FusedInferAttentionScore 回到 vLLM-Ascend attention 源码和 CANN 文档。
Free 为什么特别多
这次 Free 特别大,但我更倾向于把它读成窗口问题,而不是“某个 free kernel 很慢”。
证据链是:
StepTraceTime的Stage是528.78 s,Computing是68.26 s,Free是460.52 s。- 主要 device kernel 的 first/last timestamp 集中在
0.33 s到82.70 s。 TASK和CANN_API的 span 接近529.7 s,说明 profiler 覆盖了更长的 host/session 时间。- host API 里
aclrtSynchronizeEvent和aclrtSynchronizeStreamWithTimeout很高,说明等待和同步不是小数。
因此,当前能追溯的结论是:本次 trace 不能用 Free 直接解释 device kernel 性能。更可靠的下一步是:
- 用更窄的 profiling range 包住单次请求或若干 decode iteration。
- 把 vLLM scheduler step、model forward、sampler、output processor 分别打 NVTX/torch profiler range。
- 对齐
kernel_details.csv的 timestamp、operator_details.csv的 host range、rollout loop 日志的 request 时间。 - 单独统计
aclrtFreePhysical、allocator、KV block free 和 request 完成事件,不把它们和StepTraceTime.Free混为一谈。
npu_fx_compiler inference 怎么看
npu_fx_compiler inference 在本次 trace 中出现 15 次,host total 约 7.75 s,device total 约 1.99 s。这个名字更像 torch/NPU FX 编译或图执行边界的 profiler range,不是一个具体 device kernel。
它容易让人困惑,是因为这个 host range 里可能包着许多小的 aten、NPU custom op、图捕获/回放相关调用。阅读时建议按三步拆:
- 先看它包住哪些 PyTorch API 子事件。
- 再看这些子事件落到哪些 CANN API 和 device kernel。
- 最后按 graph capture、graph replay、dynamic fallback 三类归档。
如果在 npu_fx_compiler inference 里看到了 vllm::gdn_attention_core,不要直接说“FX compiler 在跑 prefill”。它只是 host 范围,里面的 GDN 自定义 op 仍要继续按 metadata 分支拆开。
论文证据补充
GDN 不是随手发明的推理融合算子,它背后是模型结构变化。Gated Delta Networks 论文的吞吐图显示,在相同单 H100 GPU 条件下,Gated DeltaNet 这类结构在训练吞吐上相对 full attention 有明显优势。9
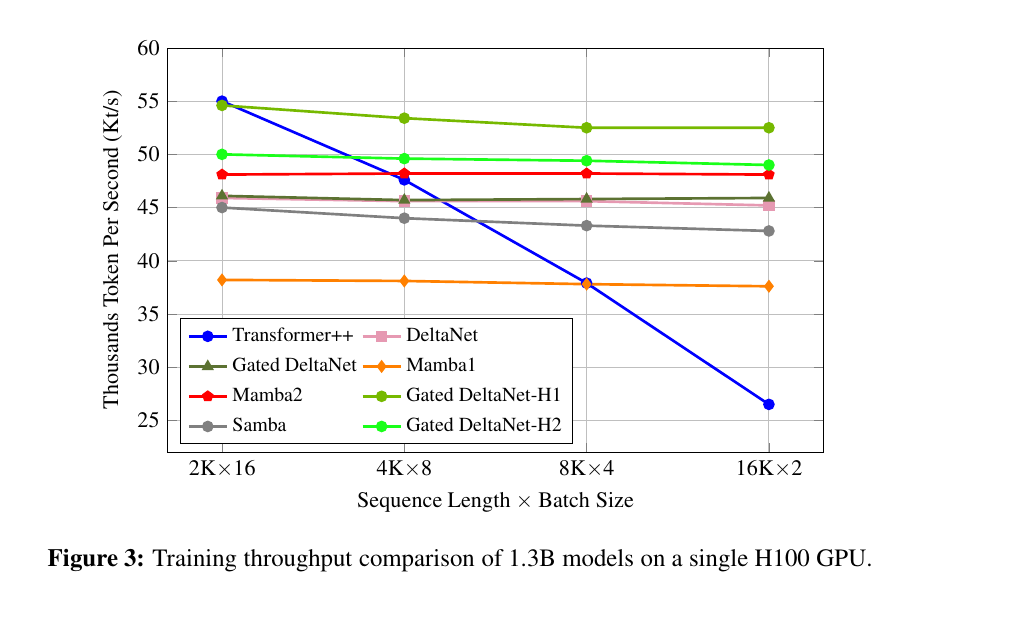
这张图不能直接证明本次 NPU 推理 kernel 的收益,因为硬件、实现和任务都不同;但它能帮助建立正确问题:当模型结构从 full attention 变成 GDN/attention hybrid 时,profiling 字典也要跟着更新。否则会把 recurrent state kernel 当成陌生噪声。
新模型融合算子跟踪
以后遇到新模型、新 backend 或新融合算子,可以按下面顺序走。
-
先建四张表 从
op_statistic.csv、kernel_details.csv、operator_details.csv、api_statistic.csv分别建 step 表、host API 表、device kernel 表、shape/timestamp 表。 -
按名字分域
vllm::xxx:vLLM custom op 或 torch custom op。aclnnXXX:CANN ACLNN API。torch_npu.npu_xxx:torch-npu 高层接口。xxx_kernel_0:Triton、AscendC 或编译生成 kernel。-
xxx_hash_suffix:优先按 base op 搜索,hash 当成 static specialization 线索。 -
先搜 base op,不搜全名 例如搜
GemmaRmsNorm、FusedInferAttentionScore、fused_sigmoid_gating_delta_rule_update,不要一上来搜完整 hash 名字。 -
把 host 和 device 分开 host total 高,可能是同步、调度、Python/C++ wrapper、workspace 查询或图参数更新;device total 高,才是 kernel 本体更热。
-
把 prefill、decode、spec decode 分开 对 vLLM,要看
query_lens、query_start_loc、num_prefills、num_decodes、num_spec_decodes,不要只看 op 名字。 -
把 graph dynamic/static 分开 同一个 base op 同时有 dynamic 和 static 名字时,先比较 call count、shape、first/last timestamp,再判断是不是 warmup、fallback、capture 或 replay。
-
把 sampling 单独拉出来 random、uniform、multinomial、exponential、copy、to、nonzero 等路径都可能很热,但它们优化的是 generation pipeline,不是 attention/MLP 本体。
-
最后才写收益判断 只有当源码和 trace 同时支持时,才说“融合了什么、收益来自哪里”;否则写成“当前 trace 支持的解释”和“仍需验证”。
可复用 prompt
这次的重复分析 prompt 已沉淀到 obsidian-vault/wiki/meta/VLLM Inference Profiling Rule.md。以后遇到新模型 profiling,可以直接按那份 rule 生成 raw source、source synthesis、operator dictionary 和 Hugo 文章。
总结
这次 profiling 最重要的收获不是记住某个 kernel 名字,而是建立一个分层读法:
Free先看窗口:本次Free=460.52 s更像 step/session 覆盖过宽,不是某个 kernel 本体慢。vllm::gdn_attention_core不是 prefill-only:它是 GDN core custom op,内部按 metadata 分支到 prefill、decode、spec decode 或 mixed path。fused_sigmoid_gating_delta_rule_update_kernel_0是 GDN decode 热点:它融合 gate、delta rule、state update 和 output reduction。FusedInferAttentionScore_...先还原成 FIA:hash 后缀更像 static graph/shape 专门化标签,语义要回到 CANN FIA 和 vLLM-Ascend attention 源码。aclnnInplaceUniform...先按 sampling 查:它很热,但不是模型层 attention。
推理 profiling 的难点在于:一个 step 里同时有系统、框架、模型结构和后处理。把这些层拆开,陌生融合算子的名字就不会那么吓人。
参考文献
-
Kwon et al., "Efficient Memory Management for Large Language Model Serving with PagedAttention", arXiv, https://arxiv.org/abs/2309.06180. ↩
-
vLLM optimization and chunked prefill documentation, https://docs.vllm.ai/en/stable/configuration/optimization.html. ↩
-
vLLM profiling documentation, https://docs.vllm.ai/en/stable/contributing/profiling.html. ↩
-
vLLM-Ascend service profiling guide, https://docs.vllm.ai/projects/ascend/en/latest/developer_guide/performance_and_debug/service_profiling_guide.html. ↩
-
vLLM-Ascend ACL graph source, https://raw.githubusercontent.com/vllm-project/vllm-ascend/main/vllm_ascend/compilation/acl_graph.py. ↩
-
vLLM GDN attention backend and Qwen GDN core source, https://raw.githubusercontent.com/vllm-project/vllm/main/vllm/v1/attention/backends/gdn_attn.py, https://raw.githubusercontent.com/vllm-project/vllm/main/vllm/model_executor/layers/mamba/gdn/qwen_gdn_linear_attn.py. ↩
-
vLLM-Ascend fused sigmoid gating delta rule source, https://raw.githubusercontent.com/vllm-project/vllm-ascend/main/vllm_ascend/ops/triton/fla/sigmoid_gating.py. ↩
-
Ascend CANN
FusedInferAttentionScoredocumentation, https://gitee.com/ascend/cann-ops-adv/raw/master/docs/FusedInferAttentionScore.md. ↩↩ -
Yang et al., "Gated Delta Networks: Improving Mamba2 with Delta Rule", arXiv, https://arxiv.org/abs/2412.06464. ↩↩